7. Python#
Python is a versatile general-purpose language with wide applications. Python’s accessibility and widespread availability make it an excellent choice for researchers of all backgrounds. Furthermore, the integration of ChatGPT, an AI language model, can transform the learning experience, even for those who have never programmed before.
Type: General-purpose programming language
Primary Uses: Web development, scientific computing, artificial intelligence, data analysis, and more
Paradigms: Object-oriented, imperative, functional
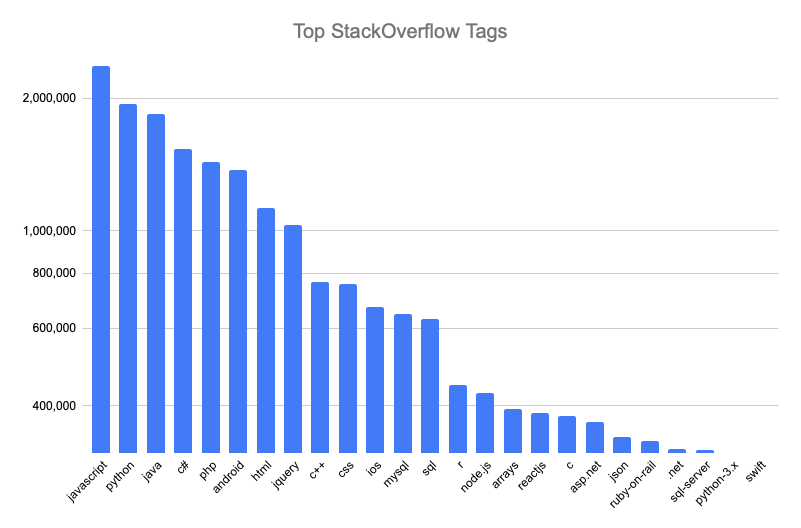
Community: Extensive libraries and a large community, making it very versatile. According to some sources, Python is the second most popular programming language in the world.

The PS5 of Programming Languages
Your Gaming Console for Research
Just like a PlayStation 5 (PS5) serves as a versatile console for different gaming experiences—from FIFA World Cup to NBA and action-adventures—you can think of Python as your universal “console” for research. Want to dive into web development? Python has Django. Interested in data analysis? There’s pandas. How about scientific computing? Say hello to NumPy and SciPy. Machine learning? You’ve got scikit-learn and TensorFlow.
Installing “Game Packages” for Different Experiences
The best part? You don’t need to buy a new console for each genre; you just need to install a new “game” or, in Python terminology, a library or framework. These libraries and frameworks act like your PS5 games; they’re specialized tools that allow you to accomplish specific tasks. Need to “score goals” in data analysis? “Install” pandas and matplotlib to start “playing”. Interested in AI? “Download” TensorFlow or PyTorch and jump right into the “game”.
Game Boosters: Google Colab and ChatGPT
Google Colab is like your cloud-based multiplayer arena, where you can run Python “games” without any installations, and invite others to join in on the fun. It’s like PlayStation Network but for code.
And what’s better to help you along your quest than ChatGPT? Think of it as that in-game assistant or tutorial mode that guides you through quests, offers hints, or even helps you write the code. It’s like having a co-op player who’s also a guide, making your journey less about obstacles and more about learning and achievement.
Leveling Up: From Beginner to Pro
In the gaming world, you can start as a newbie and level up as you gain experience. Python offers the same trajectory. You can start by scripting basic programs and gradually move up to developing complex machine learning models or automating large data analyses, just as you might go from playing beginner levels to advanced challenges in a game.
Quizzes:
Python Libraries:
Question: Which Python library is renowned for plotting and graphing?
A)
StatsmodelsB)
SeabornC)
PyMC3D)
Requests
Answer: B) Seaborn
Hands-on Exercises:
Simple Python Exercise with ChatGPT:
Objective: Use ChatGPT to help you write a Python program to compute the sum of numbers from 1 to 100.
Steps:
Open Google Colab.
Start a new Python notebook.
In a code cell, type out your question for ChatGPT, for example: “Help me write a Python program to compute the sum of numbers from 1 to 100.”
Use the response to execute the Python code.
Expected Code Block:
sum_numbers = sum(range(1, 101))
print(sum_numbers)
GitHub Copilot Exercise:
Objective: Use GitHub Copilot to help you write a Python function to reverse a string.
Steps:
Open Google Colab.
Start a new Python notebook.
Begin typing a function definition like:
def reverse_string(s):Let GitHub Copilot suggest the completion.
Execute the function with a test string to see the reversed result.
Expected Code Block:
def reverse_string(s):
    return s[::-1]

print(reverse_string("Hello, World!"))
Data Visualization Exercise with Google Colab:
Objective: Create a bar chart showing the popularity of Python libraries.
Steps:
Open Google Colab.
Start a new Python notebook.
Copy the following code block and execute.
Code Block:
import matplotlib.pyplot as plt

libraries = ['Pandas', 'Matplotlib', 'Seaborn', 'Scikit-learn', 'Statsmodels', 'PyMC3', 'TensorFlow', 'NLTK']
popularity = [95, 85, 80, 92, 70, 65, 90, 75]

plt.bar(libraries, popularity, color='blue')
plt.xlabel('Python Libraries')
plt.ylabel('Popularity Score')
plt.title('Popularity of Python Libraries')
plt.xticks(rotation=45)
plt.tight_layout()
plt.show()
How to install pandas on your computer in a unix environment (Mac or Linux):
pip install pandas
The syntax is the same for all packages that you want to install. Just replace pandas with the name of the package you want to install.
In Windows, you can install packages by opening the Anaconda Prompt and typing the same command as above.
import numpy as np
import matplotlib.pyplot as plt
from scipy import stats
import pandas as pd
Import the CSV file:
# Read the CSV file into a DataFrame
df = pd.read_csv('~/dropbox/1f.ἡἔρις,κ/1.ontology/donor_live_keep.csv')
You can find the dimensions of a DataFrame using the .shape attribute. This attribute returns a tuple representing the dimensions of the DataFrame, where the first element is the number of rows and the second is the number of columns.
Here’s how to find the dimensions of your DataFrame df:
# Get the dimensions of the DataFrame
rows, cols = df.shape

# Print the dimensions
print(f"The DataFrame has {rows} rows and {cols} columns.")
This will give you a quick idea of how large your dataset is.
Next, you can use the .head() method to print the first 5 rows of your DataFrame. This is a good way to get a feel for what information is in your dataset. You can pass a number into the .head() method to print a different number of rows. For example, df.head(10) will print the first 10 rows of your DataFrame.
df.head()
You can restrict the DataFrame to a subset of rows and columns using slicing. Here’s how to keep only the first 1000 rows and the first 9 columns:
# Subset the DataFrame
subset_df = df.iloc[:1000, :9]

# Show the shape of the new DataFrame to confirm
print(f"The shape of the subset DataFrame is {subset_df.shape}")
Explanation:
df.iloc[:1000, :9]uses theilocindexer for Pandas DataFrames. The:1000selects the first 1000 rows and the:9selects the first 9 columns.subset_df.shapewill display the shape of the new DataFrame, which should be (1000, 9) to confirm that you’ve correctly subsetted it.
Now subset_df contains only the first 1000 rows and the first 9 columns of the original df.
subset_df.head()
# Select the first 100 rows and cherry-pick columns by index (e.g., columns at index 0, 2, 4, and 6)
subset_csv = df.iloc[:100, [3, 4, 6]]
subset_csv.to_csv('~/dropbox/1f.ἡἔρις,κ/1.ontology/subset.csv', index=False)
I copied and pasted a tiny subset of the data into a new file called subset.csv. This file contains only the first 100 rows and cherry-picked columns from the original dataset. You can download it here.
You can copy and paste the .csv file into ChatGPT and ask it to perform some task in Python. For example:
# Summary statistics to identify continuous variables
cont_summary = subset_df.describe()
print("Continuous Variables:")
print(cont_summary.columns.tolist())  # These are likely to be continuous variables

# Identify binary variables
binary_vars = [col for col in subset_df.columns if subset_df[col].nunique() == 2]
print("\nBinary Variables:")
print(binary_vars)

# Identify categorical variables
cat_vars = [col for col in subset_df.select_dtypes(include=['object']).columns if col not in binary_vars]
print("\nCategorical Variables:")
print(cat_vars)
Continuous Variables:
['pers_id', 'don_age_in_months', 'don_age', 'don_race']

Binary Variables:
['don_gender', 'don_ethnicity_srtr']

Categorical Variables:
['don_ty', 'don_home_state', 'don_race_srtr']
import numpy as np
import matplotlib.pyplot as plt
from scipy import stats

# Sample data (replace with your own)
ages = subset_df['don_age'].dropna()  # Remove NaN values if any

# Add jitter to x-values for visualization
np.random.seed(42)
jitter = np.random.normal(0, 0.1, len(ages))

# Scatter plot
plt.scatter(jitter, ages, color='lime', alpha=0.5, label='Data Points')

# Calculate mean and 95% CI for ages
mean_age = np.mean(ages)
confidence = 0.95
std_dev = np.std(ages)
ci = std_dev * stats.t.ppf((1 + confidence) / 2, len(ages) - 1)

# Overlay mean as a horizontal line (in gray)
plt.axhline(y=mean_age, color='gray', linestyle='--', label=f'Mean Age: {mean_age:.2f}')

# Overlay mean as a blue dot
plt.scatter(0, mean_age, color='blue', zorder=5, label='Mean')

# Overlay 95% CI as a vertical error bar (in orange)
plt.errorbar(0, mean_age, yerr=ci, color='orange', fmt='o', capsize=5, label=f'95% CI: {mean_age - ci:.2f} - {mean_age + ci:.2f}')

# Remove x-axis ticks, labels, and title
plt.xticks([])
plt.xlabel('')

plt.ylabel('Age (years)')
plt.title('Jittered Scatter Plot of Age with Overlaid Mean and 95% CI')
plt.legend()
plt.tight_layout()
plt.show()

