#
Show code cell source
import networkx as nx
import matplotlib.pyplot as plt

# Set seed for layout
seed = 6

# Directory structure
structure = {
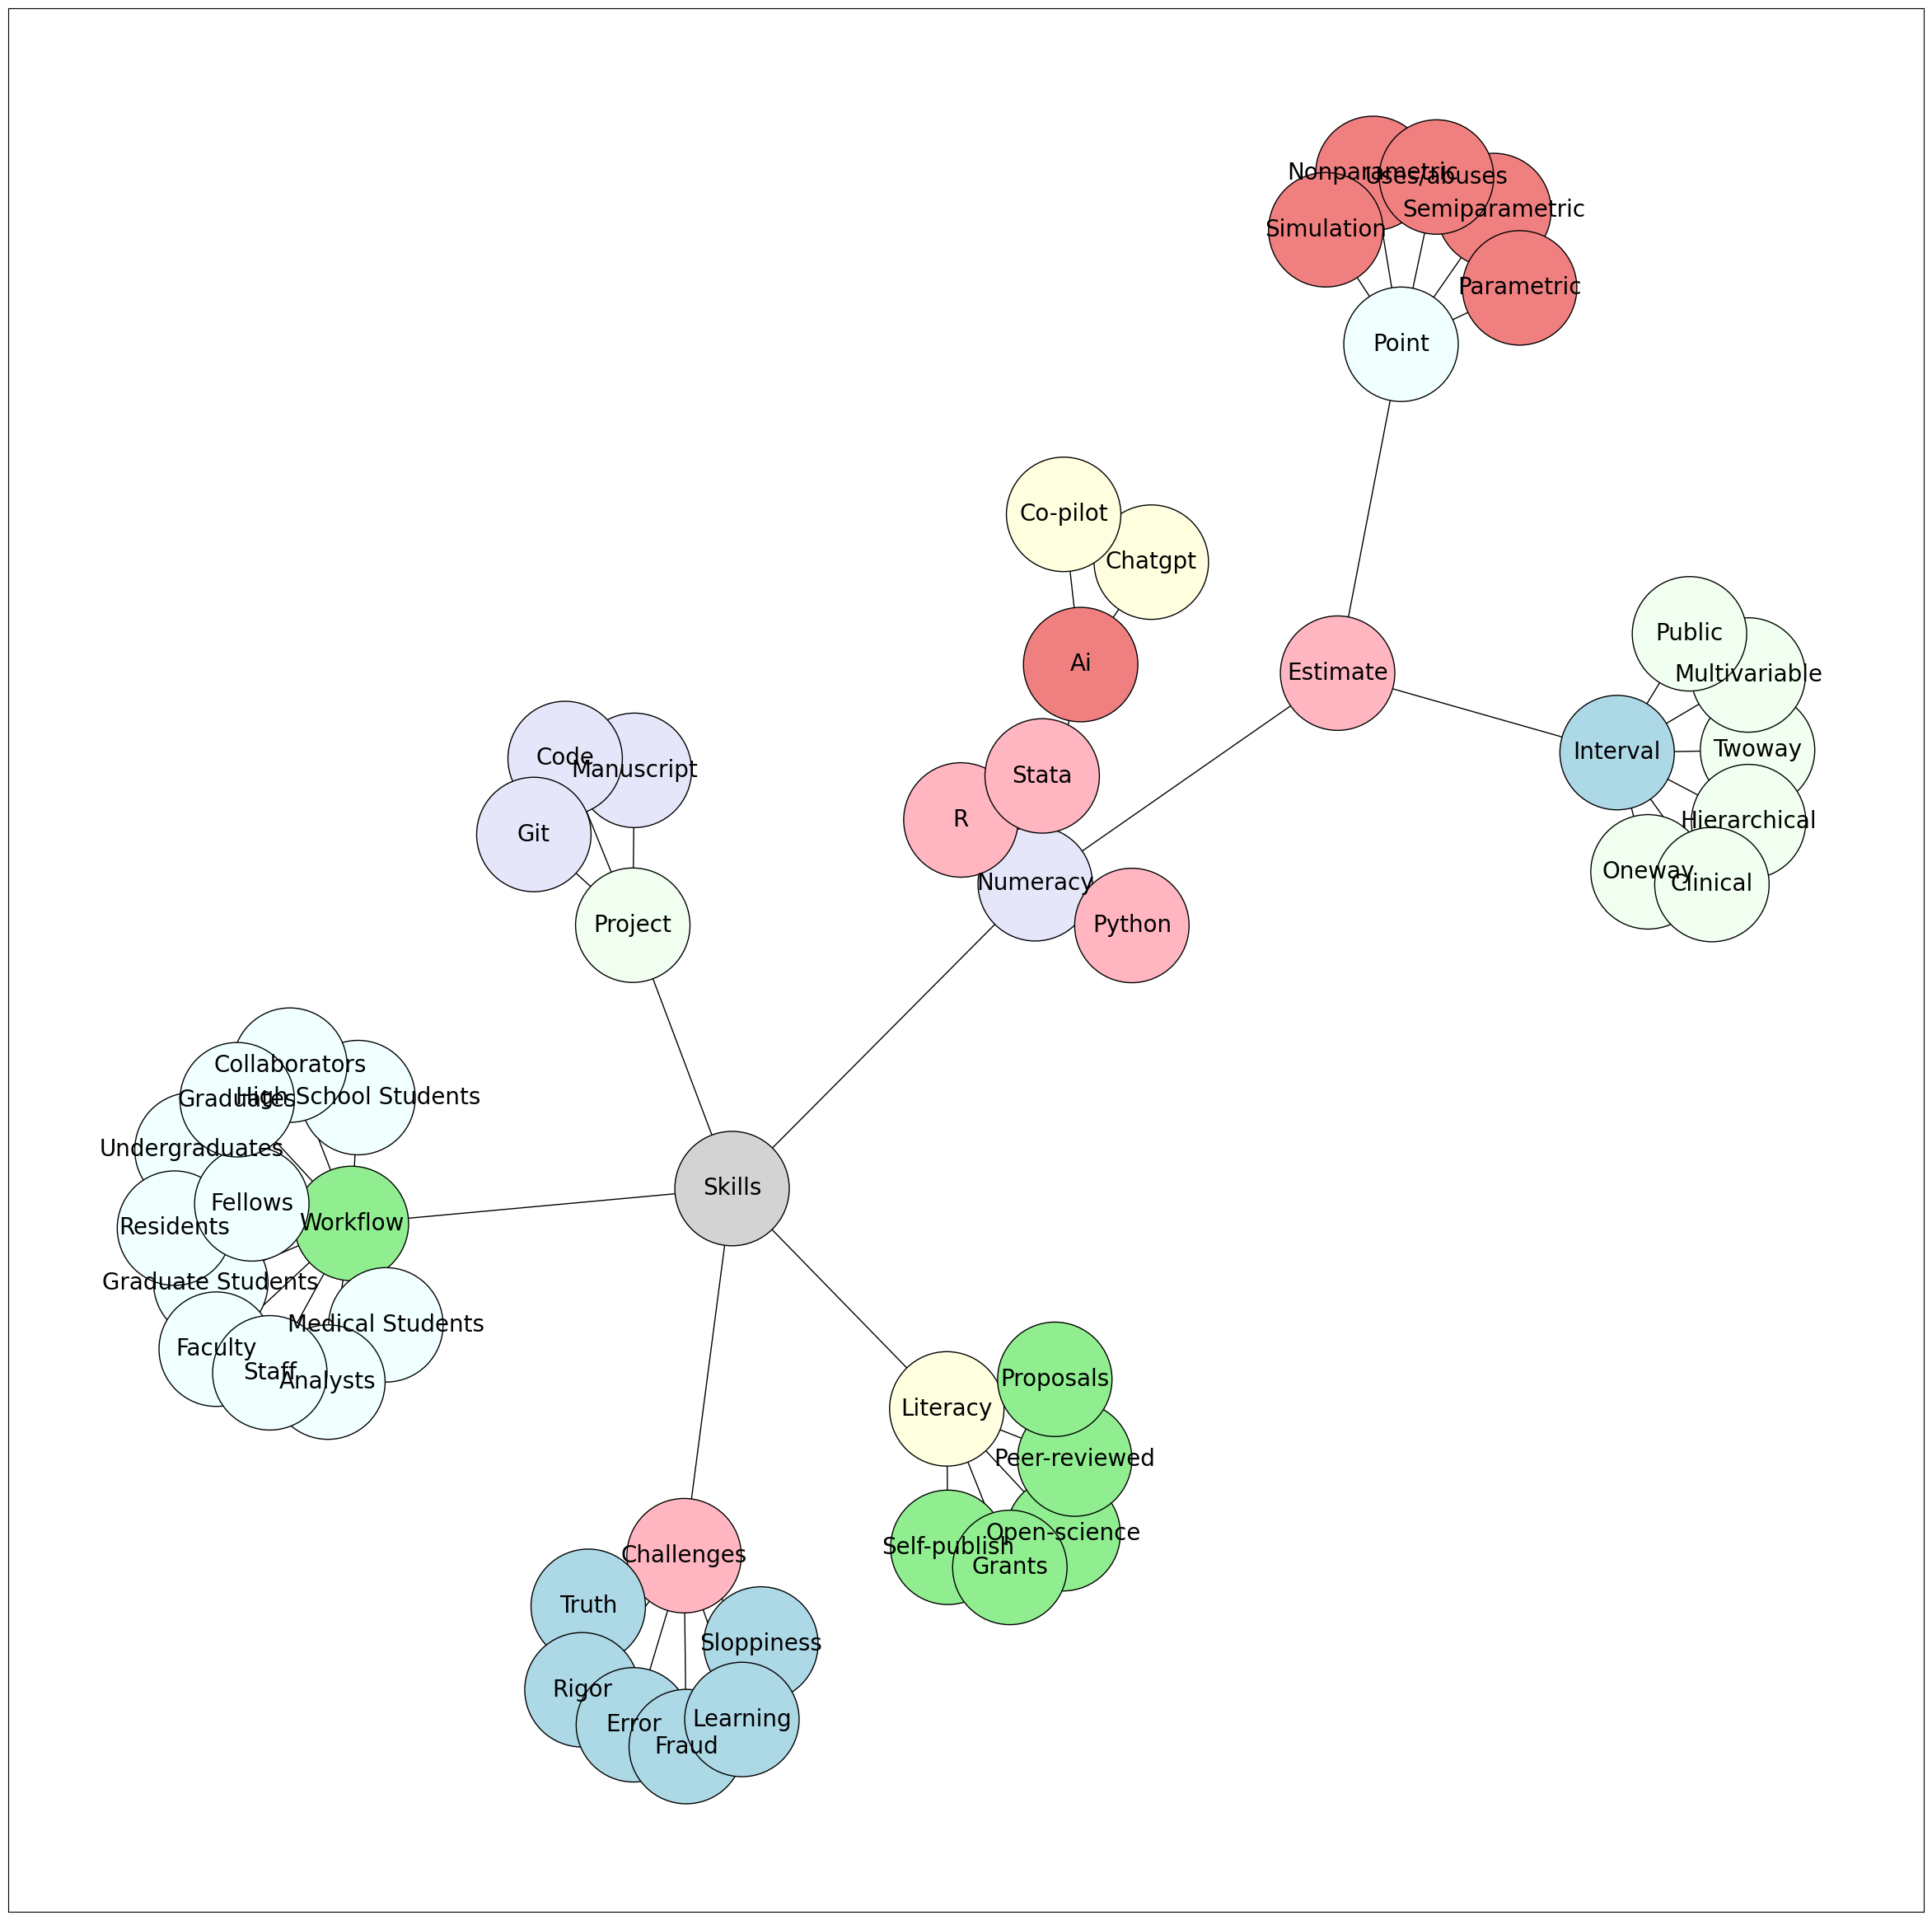
    "Skills": ["Literacy", "Project", "Numeracy", "Workflow", "Challenges"],
    "Estimate": ["Interval", "R01", "K24", "U01"],
    "Literacy": ["Open-Science", "Self-Publish", "Peer-Reviewed", "Grants", "Proposals"],
    "Numeracy": ["Python", "AI", "R", "Stata", "Estimate"],
    "AI": ["ChatGPT", "Co-Pilot"],
    "Project": ["Manuscript", "Code", "Git"],
    "Point": ["Nonparametric", "Semiparametric", "Parametric", "Simulation", "Uses/Abuses"],
    "Estimate": ["Point", "Interval"],
    "Interval": ["Oneway", "Twoway", "Multivariable", "Hierarchical", "Clinical", "Public"],
    "Workflow": ["High School Students", "Undergraduates", "Graduate Students", "Medical Students", "Residents", "Fellows", "Faculty", "Analysts", "Staff", "Collaborators", "Graduates"],
    "Challenges": ["Truth", "Rigor", "Error", "Sloppiness", "Fraud", "Learning"],
}

# Gentle colors for children
child_colors = ["lightgreen", "lightpink", "lightyellow",
    'lavender', 'lightcoral', 'honeydew', 'azure','lightblue',
]

# 'lightsteelblue', 'lightgray', 'mintcream','mintcream', 'azure', 'linen', 'aliceblue', 'lemonchiffon', 'mistyrose'

# List of nodes to color light blue
light_blue_nodes = ["Literacy", "Numeracy", "You", "Project", "Challenges"]

G = nx.Graph()
node_colors = {}


# Function to capitalize the first letter of each word
def capitalize_name(name):
    return ' '.join(word.capitalize() for word in name.split(" "))

# Assign colors to nodes
for i, (parent, children) in enumerate(structure.items()):
    parent_name = capitalize_name(parent.replace("_", " "))
    G.add_node(parent_name)

    # Set the color for Skills
    if parent_name == "Skills":
        node_colors[parent_name] = 'lightgray'
    else:
        node_colors[parent_name] = child_colors[i % len(child_colors)]

    for child in children:
        child_name = capitalize_name(child.replace("_", " "))
        G.add_edge(parent_name, child_name)
        if child_name in light_blue_nodes:
            node_colors[child_name] = 'lightblue'
        else:
            node_colors[child_name] = child_colors[(i + 6) % len(child_colors)]  # You can customize the logic here to assign colors


colors = [node_colors[node] for node in G.nodes()]

# Set figure size
plt.figure(figsize=(30, 30))

# Draw the graph
pos = nx.spring_layout(G, scale=30, seed=seed)
nx.draw_networkx_nodes(G, pos, node_size=10000, node_color=colors, edgecolors='black')  # Boundary color set here
nx.draw_networkx_edges(G, pos)
nx.draw_networkx_labels(G, pos, font_size=20)
plt.show()

Graduates
Tania Kapoor
Umair Iqbal
Vaibhav Gupta
Waqar Aziz
Xia Wang
Yusuf Hussain
Zara Noor
Arif Raza
Bindya Suresh
Chetan Krishnan
Deepa Srinivasan
Erfan Qadri
Falak Shah
Geeta Chawla
Hammad Rizwan
Indu Verma
Jamshed Mir
Khushboo Arora
Latif Rahman
