cls
if 0 {
nhanes_fena, ys(2013) ye(2018) mort
table1_fena
}
if 0 {
riagendr mortstat
ridreth1
seqn ridageyr permth_int permth_exm
}
if 1 {
use NHANES_base_2013_2018, clear
g years=permth_exm/12
stset years, fail(mortstat==1)
label define Race ///
1 "Mexican" ///
2 "Hispanic" ///
3 "White" ///
4 "Black" ///
5 "Asian"
label values ridreth1 Race
}
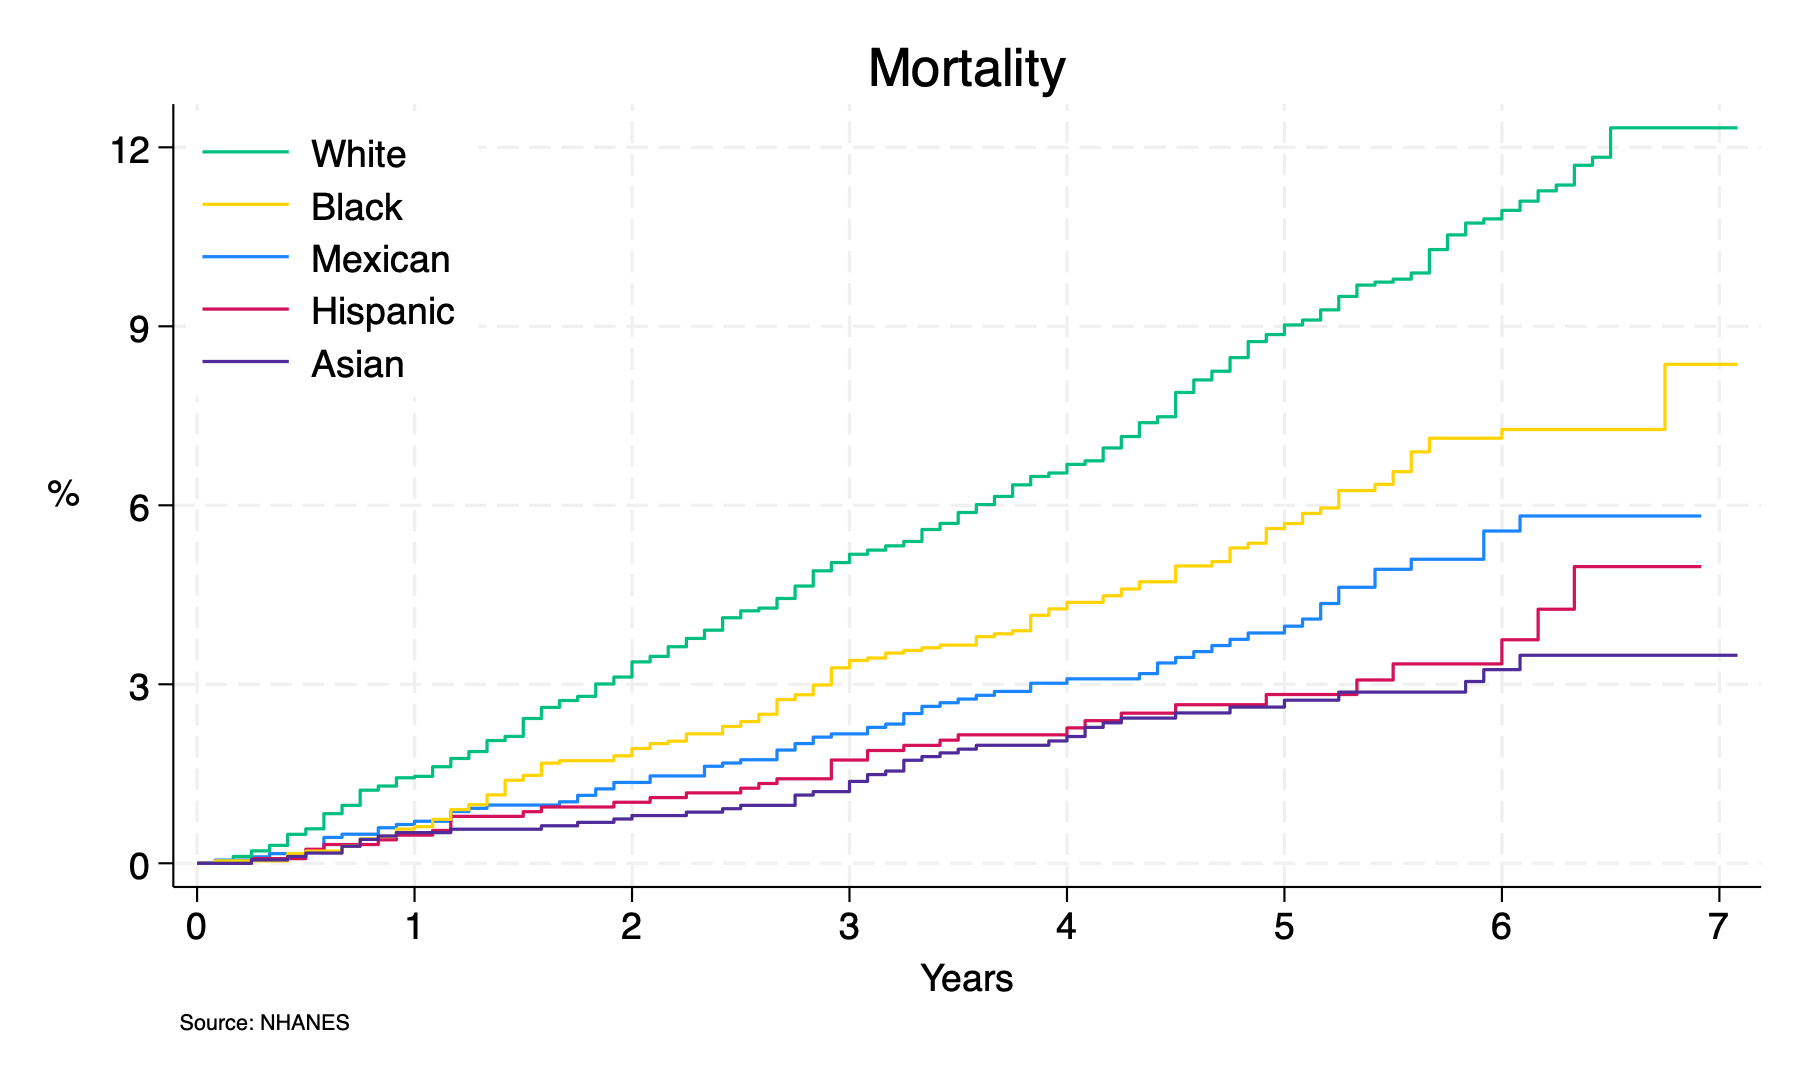
if 0 { // nonparametric
sts graph, ///
by(ridreth1) ///
fail ///
per(100) ///
ti("Mortality") ///
ylab(0(3)12, ///
format(%2.0f) ///
) ///
xlab(0(1)7) ///
xti("Years") ///
yti("%", orientation(horizontal)) ///
caption("Source: NHANES",size(2)) ///
legend(on ///
ring(0) ///
pos(11) ///
lab(1 "Mexican") ///
lab(2 "Hispanic") ///
lab(3 "White") ///
lab(4 "Black") ///
lab(5 "Asian") ///
order(3 4 1 2 5) ///
)
sts list, by(ridreth1) saving(km_estimates, replace )
preserve
//see if egen is better than collapse
use km_estimates, clear
replace time=round(time,1)
g mortality=(1-survivor)*100
//report absolute risk by followup duration
collapse (max) mortality, by(time ridreth1)
list if ridreth1==3
list if ridreth1==3 & time==7 //7y mortality for white participants
restore
//absoluste risk from nonparametric methods
graph export mortality_np.png, replace
}
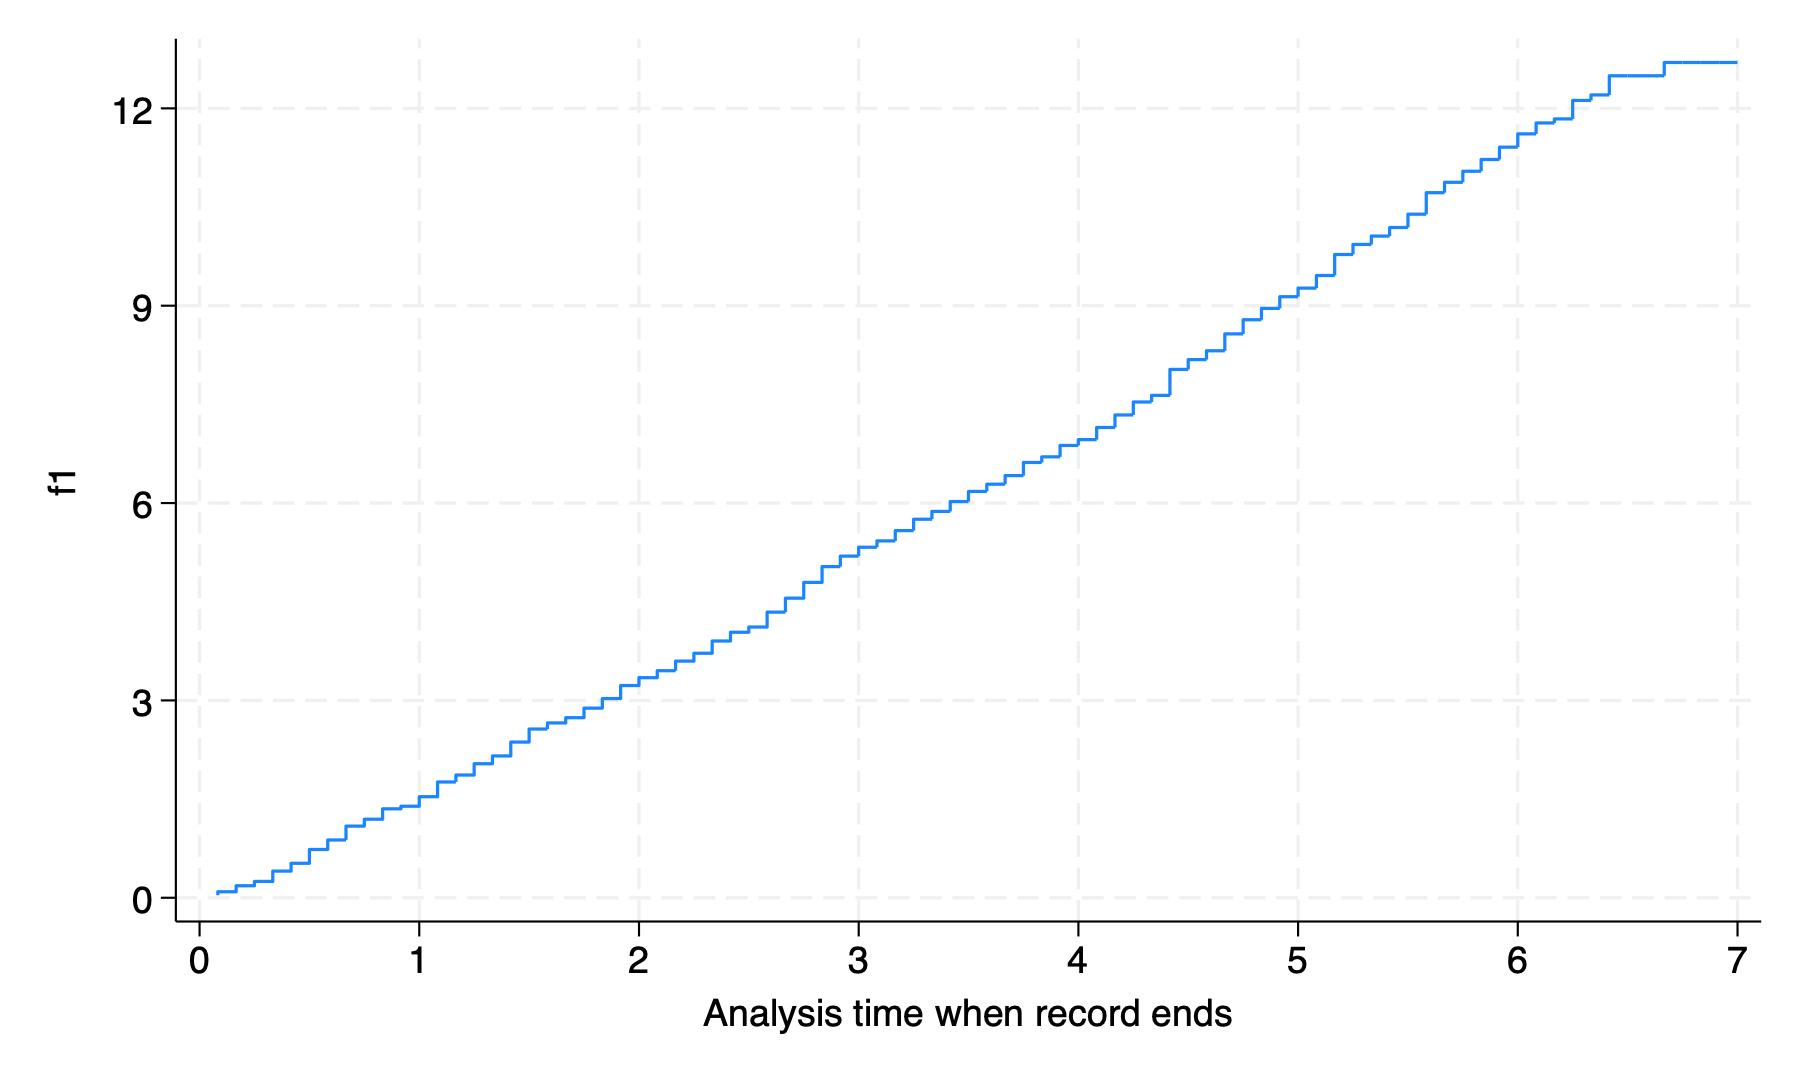
if 0 {
//semiparametric methods
// s0 is base-case survivor function: nonparametric
stcox i.ridreth1, basesurv(s0)
matrix define cox=r(table)
matrix list cox
//matrix dimentions
local m = rowsof(cox)
local n = colsof(cox)
display "The number of rows is: " `m'
display "The number of columns is: " `n'
//cols(cox) = 5 & the third is "White"
//from https://jhufena.github.io/home/act0/act_0_7/act_0_0_7_8.html
matrix SV = (0, 0, 1, 0, 0)
matrix risk_score = SV * cox'
matrix list risk_score
// hazard ratio: parametric compared with nonparametric base-case
// thus, semi-parametric (i.e., only half-parametric)
di risk_score[1,1]
g f0 = (1-s0) * 100
g f1 = f0 * risk_score[1,1]
drop if _t > 7
//absolute risk from semiparametric methods
line f1 _t, sort connect(step step) ylab(0(3)12) xlab(0(1)7)
graph export mortality_sp.png, replace
coefplot, xline(1) xlabel(.5 1 2 3) eform
graph export fig1_coefplot.png, replace
}
if 0 {
clear
matrix c=cox'
svmat c
matrix list c
g x=_n
foreach v of varlist c1 c5 c6 {
replace `v'=log(`v')
}
twoway (scatter c1 x)(rcap c5 c6 x, ///
yline(0) ///
xlab(1 "Mexian" 2 "Hispanic" 3 "White" 4 "Black" 5 "Asian") ///
ylab(-1.39 "0.25" -0.69 "0.5" 0 "1" 0.69 "2" 1.39 "4" ) ///
xti("") ///
yti("HR (95%CI)", orientation(horizontal)) ///
legend(off) ///
ti("7-Year Mortality") ///
)
graph export fig1_manual.png, replace
}
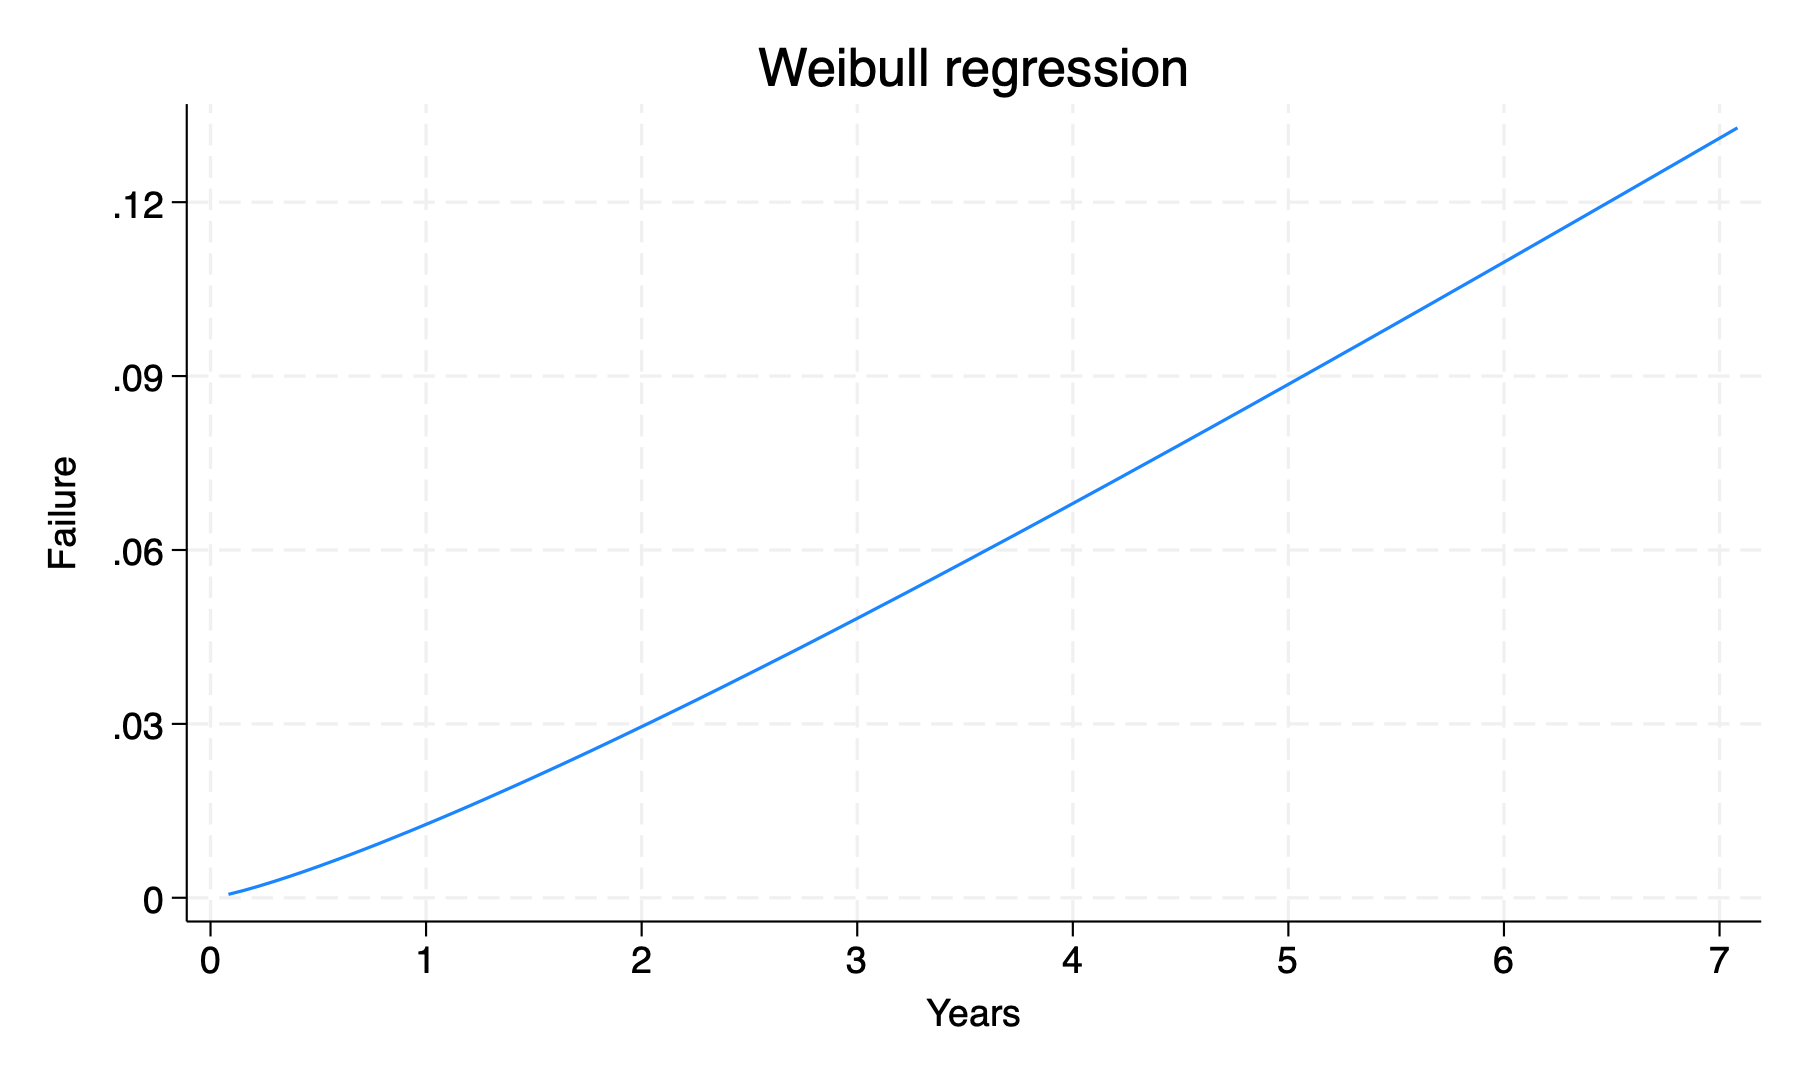
if 1 { //parametric methods
streg i.ridreth1, d(weibull)
matrix define w =r(table)
matrix list w
//can't figure out how to have the y-scale from 0 to 100%
stcurve, failure at(ridreth1==3) xti("Years") xlab(0(1)7) ylab(0(.03).12)
graph export mortality_p.png, replace
g lambda=w[1,7]
g p=w[1,8]
//g failure_prob = (1 - exp(-1 * (lambda * _t)^p))*100
//line failure_prob _t, sort xlab(0(1)7)
replace _t=round(_t)
predict s if ridreth1==3, surv
collapse (max) s, by(_t)
g f=(1-s)*100
list //7y mortality for white participants similar regardless of method
//streg (parametric)
//stcox (semiparametric)
//km (nonparametric)
}